
More growing days. Fewer days of frost. And more extreme weather: both drought-inducing heat waves and bitterly cold stretches.
That’s the reality of climate change but are those changes happening on your farm?
Now you can find out thanks to an easy-to-use website that details precipitation, temperature and growing days on virtually any chunk of Alberta over the last seven decades.
“When the media reports on climate change we hear all about how we have to stay below a rise of 1.5 degrees globally,” said Stefan Kienzle, a geography and environmental professor at the University of Lethbridge.
Read Also

Alberta producers set record for environmental farm plans in 2025
Albertan farmers and ranchers completed a record number of Environmental Farm Plans in 2025.
“But that doesn’t mean anything for the people on the street who have no idea how that translates into their own lives.”
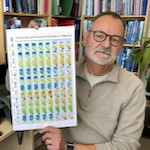
Kienzle used weather data going back seven decades to create the Alberta Climate Records website. It took three years of his spare time (along with the help of others) to put this data (collected from hundreds of weather stations) into an accessible and relatable form for public use.
A GOLD MINE OF WEATHER DATA
There’s a treasure trove of weather data for every piece of farmland in the province at Alberta Climate Records. Take a walk-through and learn how to use this detailed and versatile tool here.
Take, for example, an area in central Alberta (about a dozen miles east of Red Deer). The website shows the average mean temperature increased by 2.0 C between 1951 and 2017. It also shows the growing season began about seven days earlier and ended about 10 days later, while the annual precipitation fell by 64 millimetres.
But that’s just scratching the surface.
There are six general temperature categories, 19 for cold weather, eight for hot weather, a half-dozen for the growing season and 16 for precipitation.
So for this randomly chosen location, the mean summer temperature is only 1.3 C hotter — it’s the winter (up 5.0 C) that really warmed up. And spring precipitation is actually up a bit while summer rainfall is down considerably.
Diving into this ocean of data got Kienzle thinking about a website.
“I saw that the growing season was expanding,” he said. “Our weather extremes — our heat waves and our cold spells — are increasing.
“I expected an increase in heat waves but I did not expect an increase in cold waves. That was, for me, the biggest surprise of them all.
“Once I realized all this, I said, ‘I need to share this.’”
Trends and opportunities
And there’s a lot to share.
The website allows users to pick virtually any 10-kilometre by 10-kilometre chunk of the province, so a producer can easily zoom in on the areas where their fields and pastures are located.
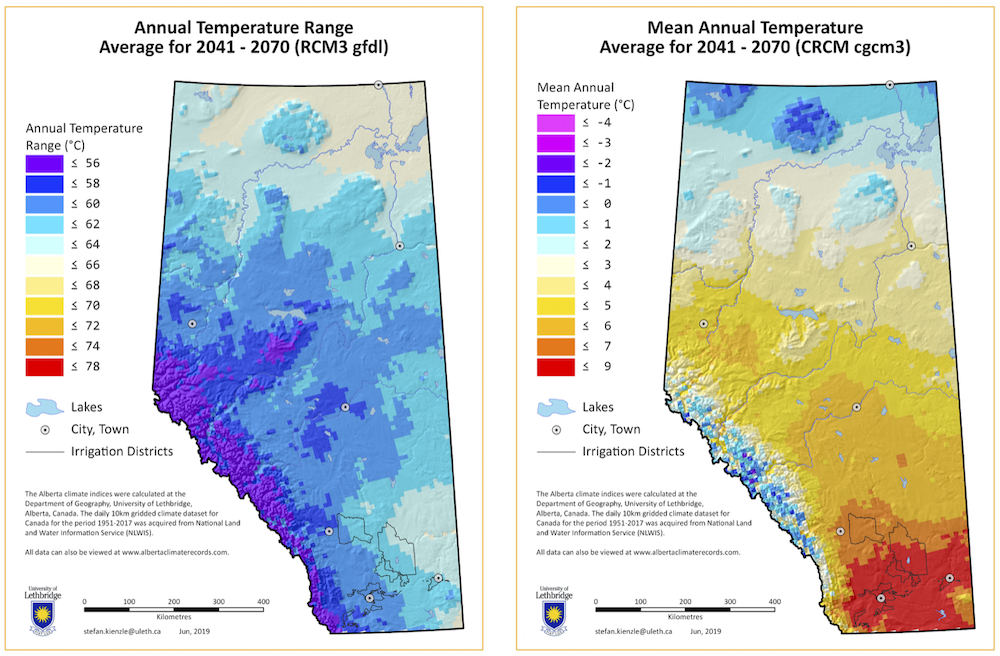
In addition to historical data, the site offers possible insights into the future, using leading climate projection models. These are divided into three categories: a future that is cooler and wetter, one that is warmer and drier and an average between the two, which Kienzle describes as the most likely scenario.
He said his hope is that producers will use the site as a rough guide to help them identify future growing opportunities. One of these may be growing days, which in general have increased (sometimes substantially) since 1951. This allows for both earlier seeding and a longer harvest window.
“On average, producers have a little bit more leeway early in the spring and later in the fall,” said Kienzle. “So the longer growing season means opportunities.”
And a longer growing season not only affects when you seed, but what you might seed.
“You can grow other crops that maybe need more heat units,” he said. “For instance, I hear there are producers in the Pincher Creek area who are thinking about growing corn one day because they will have enough units to grow corn, which is a good cash crop.”
One of Kienzle’s goals was to take the emotion out of the controversial topic of climate change by putting the focus on the data.
But it’s not just about specific numbers, either, he added.
“Don’t focus on the first or second decimal behind the number but on the trends, the ideas, the overall direction of where we’re going. Those are the key stories here,” he said.
“Many, many of these are very significant trends. They’re significant to the 99.9 percentile so 100 per cent basically. It shows that these trends are real.”
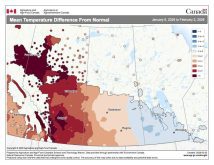
North changing faster
Although it ebbs and flows, a look at the mean temperature in Alberta from 1951 to 2017 reveals a significant increase, from 1.6 C at the southernmost part of the province to 2.6 C at the northernmost tip. This is in line with climate research that says northern areas of the world have been, and continue to be, warming at an alarming rate, said Kienzle.
“Right now they’re talking about trying to get the global increase below 1.5 C but here we’re already over 1.5 C,” he said. “In some areas we’re over 2.5 C — it’s at almost 3.0 degrees up in some areas where the average annual temperatures have increased by so much.”
Another big take-away is that despite what we’ve seen this winter, average winter temperatures have been going up. Some might think that’s a good thing, but it comes with its own production perils.
“Temperatures of below -20 C have more than halved right across Alberta so we have far fewer days that are extremely cold,” Kienzle said.
“That has an impact on our ecology. Think about the mountain pine beetle in B.C. for instance. It was kept at bay by the very cold temperatures. But with the absence of cold temperatures, they survive and there has been an infestation.”
Warmer winter temperatures also come with a less obvious, but no less concerning, risk. The site also has data on “snow water equivalent” and in many areas, it’s down sharply (by more than half at our example site east of Red Deer) as a result of reduced snowfall.
“If your snowfall declines, when it accumulates over the winter months it comes up to a maximum at some point before everything melts off,” he said. “Well, that whole maximum is much, much less now than it used to be.”
The threat of more evaporation
And the data indicates more moisture is going to be lost as summers warm up.
According to projections, some areas of southern Alberta could face between 1,400 and 1,500 millimetres of evapotranspiration (the sum of evaporation from both plants and soil) annually between 2041 and 2070. That’s compared to between 800 and 1,100 millimetres from 1991 to 2017.
That may not sound like much, but in this case a ‘millimetre’ means much more — it refers to the depths of evaporation per year.
One millimetre of depth equals one litre per square metre. So if there’s five millimetres of evaporation per day, the soil can lose five litres of water per square metre, which amounts to 20 cubic metres of water that can be lost per acre per day, said Kienzle.
“Higher evaporation rates dry out the soil faster, which means that we need more rain to balance the loss in soil moisture,” he said. “In most of the arable region in southern Alberta, annual precipitation has been in decline since the 1950s. The combination of lower — or even stable — precipitation with higher evaporation rates means drier soils, which directly results in lower crop yields.”
At present, Alberta Climate Records can only be used on desktops or laptops (there’s not a smartphone version yet), but the graphic interface makes it easy to use.
There are four introductory screens, then a user picks a climate index and time frame (or, clicks on the ‘Let’s start with… option). You then zoom and scroll to a location and click on a 10×10-kilometre square to bring up the more than four dozen climate indexes. The 67 years of data can also be sliced into 30-year chunks (although the most recent only covers the 18 years from 1991-2017). And there are also the three different future scenarios.
Alberta Climate Records was coded and organized by Christine Clark, a media student (and now an instructor at the University of Lethbridge) seeking a master’s project. Six people (Kienzle and five students) worked on the site, which Kienzle hosts himself.
– With AF staff files