Is the coming winter going to be mild or wild?
Nobody knows the answer to that question with any certainty, but there are currently three main factors likely to be the driving force behind the type of weather that’s in our future this winter.
The first is La Niña which is currently in a weak stage and is forecast to last until December or January before becoming neutral. The second possible factor is that the northern Pacific is experiencing well above average temperatures. The final factor is the early season snow cover across Siberia.
Read Also
Prairie spring forecast: What weather models predict for March to May
Weather models offer varied outlooks for Prairie spring. This forecast review compares Old Farmer’s Almanac, NOAA, CFS, CanSIPS, and ECMWF predictions for March through May temperatures and precipitation.
It’s going to take a series of articles to cover this ground, so this time we will look at La Niña, what it is and how can it impact our winter weather.
Most of us are more familiar with what the related El Niño event is. It is an unusual warming of the central and eastern parts of the equatorial Pacific Ocean. This warming changes the general circulation of the atmosphere over the Pacific. In particular, the trade winds weaken — and in some extreme cases, reverse direction. This can result in large changes in the location of heat and moisture globally and can give rise to anomalous temperature and precipitation events around the world.
La Niña is the opposite. La Niña means the little girl, and can sometimes be called El Viejo, the anti-El Niño, or simply, a cold event. La Niña occurs when there is an increase in the strength of the normal pattern of trade wind circulation. Under normal conditions, these winds move westward, carrying warm surface water to Indonesia and Australia and allowing cooler water to flow up along the South American coast. When a La Niña event occurs these trade winds are strengthened, which helps to increase the amount of up welling which in turn creates more cooler water along the coast of South and Central America and builds up warmer waters on the western side of the Ocean.
On the western side of the Pacific, the influx of warmer water causes an increase in cloud cover over southeast Asia and results in wetter-than-normal conditions for that region during the northern hemisphere winter.
Now, the big question is, what does this have to do with our weather in Western Canada?
These changes in the tropical Pacific are usually accompanied by large changes in the jet stream across the mid-latitudes (our part of the world), that shift the usual location of the jet stream across North America. This shifted jet stream can contribute to large changes in the normal location and strength of storm paths and can result in temperature and precipitation anomalies over North America that can persist for several months. Interestingly, these changes are most strongly felt in the winter.
Similar to last year, the latest La Niña advisory is predicting the current weak La Niña to continue through early 2026 before transitioning to neutral conditions. Since La Niña is expected to be on the weak side, this would likely result in limited impact on our weather. For context, let’s just take a look back and see what has happened during previous La Niña winters.
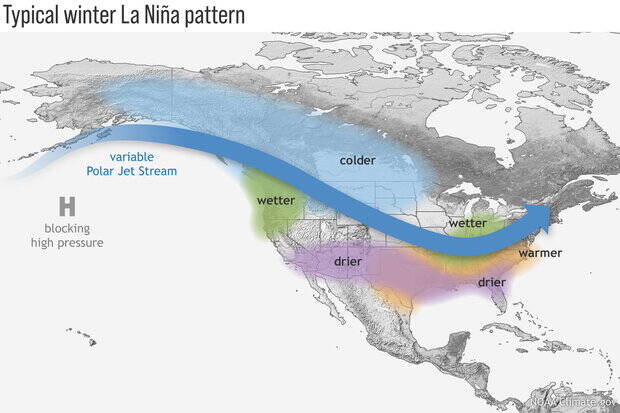
Sometimes it just easier to show the impacts of different weather events with the use of a map. If you look at the first map, it shows the typical impacts on our weather during a La Niña winter across Canada and the U.S. Typically across our region we see colder-than-average temperatures.
The problem is this map is for a strong La Niña and it is looking like we will only see a weak La Niña this winter. If we look back at the last 13 weak La Niña’s (including last winter), six of them saw near- to below-average temperatures, six were near- to above-average, and one saw above-average temperatures over the Eastern Prairies with below average temperatures over western regions. So, statistically, this does not help us out that much in predicting this winter’s temperature, as it is almost a perfect split between whether a weak La Niña winter will be warmer or colder than average.
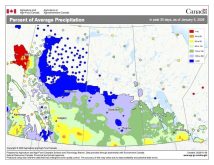
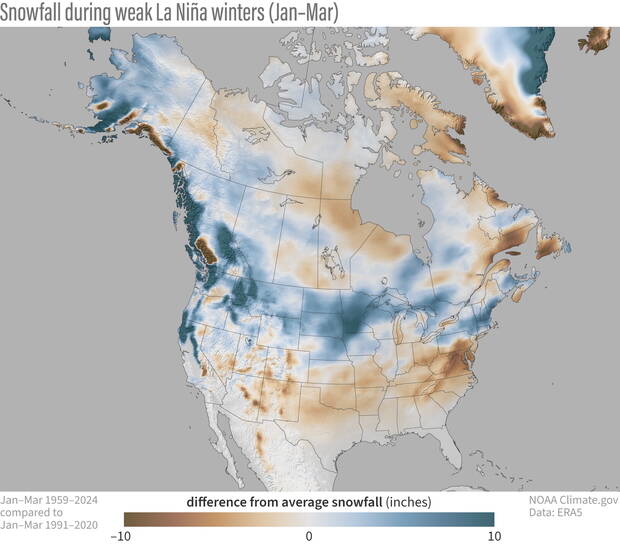
What about snowfall? Well once again we will use a map to help us visualize it. The included snow map shows the difference from average snowfall across Canada and the U.S. during the previous nine weak La Niñas. There was a map showing snowfall data for strong La Niñas, but interestingly, it was nearly identical to this map with only a few minor variations. Looking at the map, you can see that during a weak La Niña winter we will, on average, see above-average snowfall over most of Alberta and parts of extreme southern Saskatchewan along with the north central parts of Saskatchewan. The rest of south central Saskatchewan along with southern and central Manitoba typically sees near- to below-average snowfall.
In the next issue we will look at how the current warmer northern Pacific could make a mess out the typical La Niña weather pattern and will also look into what impacts an early snow pack in Siberia might have on the upcoming winter.
Before I sign off, a few interesting weather-related stories have come out. First, global temperatures in September were the third warmest on record. Secondly, scientists believe that due to warming global oceans, the world coral reefs have reached what is very possibly an irreversible die off. Lastly, global carbon dioxide levels have now reached heights that we have not seen on Earth for 800,000 years. Levels are currently at 424 ppm. When I first started writing weather articles 20 plus years ago it was around 370 ppm.