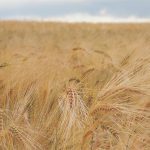
Uncertainty in commodity markets led to wide fluctuations of grain and oilseed prices in 2008. However, annual average prices of grains and oilseeds remained considerably higher than their 2007 levels. In terms of quantities produced and yields, 2008 was a good year for Canada’s grain and oilseed producers. A good harvest of grains and oilseeds and higher average prices contributed to an increase in farm cash receipts.
Prices of fertilizer and fuel continued to increase in 2008 with rising crude oil prices and consequently, shares of feed, fertilizer and fuel costs in total farm operating expenses increased further. Livestock farmers continued to face declining revenues in 2008, while dealing with rising input costs. In addition, mandatory country-of-origin labelling (COOL) regulations in the United States created uncertainties in livestock exports. However, the trade surplus in agricultural and fish products grew significantly due to the strength of wheat, canola, barley and meat exports.
Read Also

Exploring Harvest Safety
Kristin Hoffman of WSPS explains measures for increased farm safety around harvest season
In the food sector, food-safety issues came to the forefront with the outbreak of listeriosis through contaminated meat, Salmonella and E. coli contaminations of food products and melamine in some imported milk products. Following the rising trend of grain prices, Canadian retail prices of rice and wheat-based food products such as flour, bread and pasta increased significantly in 2008.
Crops and fuel price fluctuations
Low levels of global grain and oilseed inventories and an increased demand for corn, canola and soybeans in the biofuel industry were among the major factors leading to a rapid increase in their prices, especially during the second half of 2007. Prices of grains and oilseeds in the world market maintained their upward trends during the first quarter of 2008 and then fluctuated between April and August based on factors related to production and market expectations.
Rapid rising crude oil prices in 2007 increased further during the first half of 2008 to reach a record high of US$145 per barrel in the second week of July. Prices of fertilizer, diesel and heating fuel increased significantly with the rising crude oil prices.
Crude oil prices began to fall rapidly in August 2008 ending the year at US$36 per barrel, about a quarter of the peak level attained in July 2008. Grain and oilseed prices in the world market also started falling in the third quarter of 2008 before reaching close to the mid-2007 level by the end of the year.
In the Canadian domestic markets, however, the rising trend of grain and oilseed prices continued until the middle of 2008 before falling in the third quarter of the year. The prices continued to decrease, but at a much slower rate during the fourth quarter. The year 2008 ended with grain prices 29.6 per cent lower and oilseed prices 6.2 per cent higher than their respective levels at the end of 2007.
Rising crop yield
In terms of quantities produced and yields, the year 2008 was very good for Canada’s grain and oilseed producers. Production of canola in the Prairie provinces rose to 12.6 million tonnes, an increase of 31.7 per cent over the previous record production of 9.6 million tonnes in 2007. Soybean production in Ontario and Quebec, the provinces where over 90 per cent of Canada’s soybeans are grown, rose 23.7 per cent to 3.3 million tonnes, just short of the record production of 3.5 million tonnes in 2006. The production of dry field peas in the Prairies reached a record of 3.6 million tonnes in 2008.
The year 2008 was also marked by record average yields of spring wheat, barley, canola and oats in the Prairie provinces, and corn for grain in Ontario. Yields of winter wheat and soybeans both were 21.7 per cent above their respective 2007 levels. The Canadian grain and oilseed producers benefited in 2008 from these higher yields and production, good quality crops and higher market prices.
Total farm cash receipts, operating expenses increased
A good harvest of grains and oilseeds and higher prices in 2008 contributed to an increase in farm cash receipts. Total farm cash receipts for Canada increased 10.9 per cent from 2007 to reach $41.1 billion (in constant 2002 dollars) in 2008. Nearly all (96.2 per cent) of the increase was attributable to crops receipts. All provinces except Prince Edward Island gained in 2008. The percentage gain was the highest for Saskatchewan followed by Alberta. In 2008, Saskatchewan’s farm cash receipts were 20 per cent above 2007. The percentage gain for Alberta was 13.5 per cent.
A good harvest and higher prices pushed the share of crops receipts in total farm cash receipts further up in 2008 The share of total crop receipts in 2008 was five percentage points higher than 2007, while the share of receipts from livestock and program payments fell by 3.9 and 1.1 percentage points, respectively, from 2007.
At the provincial level, Saskatchewan had the highest share of crops receipts (74.9 per cent) as a proportion of total cash receipts in 2008, followed by Prince Edward Island. The share of livestock receipts was the highest in Newfoundland and Labrador followed by Nova Scotia, while the share of program payments was the highest in Quebec followed by Alberta.
Total farm operating expenses in constant 2002 dollars increased 9.2 per cent from $30.9 billion in 2007 to $33.7 billion in 2008. While farm operating expenses increased in all provinces in 2008, the rate of increase was the highest for Saskatchewan, followed by Alberta and Manitoba. In 2008, farm operating expenses in Saskatchewan were 14.5 per cent higher than 2007. In Alberta and Manitoba, expenses increased 10.9 and 10.7 per cent, respectively, from 2007. Increases in farm operating expenses were mainly due to rising feed, fertilizer and fuel prices.
Increase in feed, fertilizer and fuel expenses
Feed, fertilizer and fuel (diesel and heating) are essential inputs for farm production and together account for about one-third of total farm operating expenses in Canada. In 2008, prices of fertilizer and fuel increased with the rising crude oil prices and consequently, the 2008 share of feed, fertilizer and fuel expenses in total operating expenses was 4.4 percentage points higher than 2007. In general, a good harvest and higher grain and oilseed prices helped crop farmers to manage rising input costs. However, livestock producers faced low prices and reduced sales while dealing with rising feed and fuel expenses.
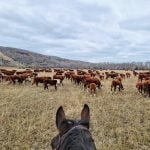
Declining revenues for livestock sector
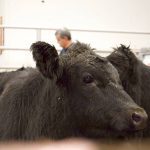
Livestock farmers continued to face declining revenues in 2008, while dealing with rising input costs. Feed prices, which were up 28.7 per cent in 2007, increased further in 2008 due mainly to higher grain prices, but average annual cattle and hog prices in 2008 remained virtually unchanged compared to 2007. While production and inventory of both hogs and cattle fell significantly in 2008, total feed costs in constant 2002 dollars increased 13.2 per cent from 2007. Heating fuel expenses also increased 10.5 per cent from 2007. This was the case for all livestock farmers, especially those in the hog sector, who had to deal with rising input costs along with substantive declines in revenues for the third consecutive year.
The cost-price squeeze faced by hog farm operators led to a restructuring of the industry and farm closures in Canada and hog inventories continued to decline in 2008. Provinces that relied on exports to the U.S. or that lost slaughter capacity were most affected. In 2008, many producers also took advantage of the federal government’s Cull Breeding Swine Program to reduce their breeding herd. At the end of 2008, Canada had an estimated 8,510 hog farms, about 1,350 fewer farms than a year earlier, and 11.8 per cent lower inventories.
During the first nine months of 2008, revenues for cattle and calf producers declined 3.8 per cent compared to the same period in 2007 because of falling receipts from both domestic and export markets. Cattle exports (number of heads) grew 14.4 per cent in 2008, but lower prices and close to parity value of the Canadian dollar to its U.S. counterpart up to the end of July dampened export receipts. Rising input costs also had an impact on producers, which exerted downward pressure on profits. The 2008 year-end cattle inventories for Canada fell 5.1 per cent from that of the previous year.
The Canadian dollar began to depreciate against the U.S. dollar in early August 2008 reaching US77 cents in early December, the lowest value in two years, before closing the year at US82 cents. The possibility of an increase in receipts from live animal exports, which could have been realized at the end of the year due to a weaker Canadian dollar, faded away as the U.S. began preparatory moves toward the introduction of its COOL regulations.
Not “cool” for Canada’s livestock industry
During the second half of 2008, the U.S. moved to enforce its COOL regulations for meat and fish products. The regulations came into full force in March 2009. According to these new regulations, only meat from animals born, raised and slaughtered in the US qualifies as “Product of U.S.” A mixed country-of-origin labelling is mandatory in all other cases. For example, meat from animals that were born and raised in Canada and imported by U.S. packers for slaughter should be labelled as “Product of Canada and U.S.” Meat from animals born in Canada and raised and slaughtered in the U.S. should also be labelled as “Product of Canada and U.S.” In both cases, packers and retailers are required to keep records of the origin of animals.
The COOL is essentially a technical barrier to trade and a way to differentiate imported products from home-grown ones. In addition, the regulations will add to the efforts related to traceability and to the costs at each stage of the production process from feedlots to processing/packing and retailing. For example, processors/packers in the U.S. will need to segregate animals and run separate production lines at their facilities, which will involve additional costs. It would be difficult to pass on these additional costs to the consumers. Therefore, this may be a disincentive for the U.S. packers to purchase Canadian animals. In effect, COOL may limit the market for Canadian live animals in the U.S., as evidenced in the hog export data.
During the first half of 2009, Canadian hog exports fell by 34.6 per cent compared to the same period in 2008. In 2008, exports of hogs were down 6.7 per cent from 2007.
The COOL regulation has also created uncertainties in the cattle markets. According to the regulation, the deadline to import feeder cattle to be classified as US beef was July 15, 2008. Cattle exports (number of heads) in the last six months of 2008 fell by 9.7% compared to the same period a year earlier. During the first half of 2009, cattle exports declined by 31.7% from the same period in 2008.
Food safety issues
Food safety issues received widespread attention as a number of listeriosis cases were reported in the summer of 2008. These were linked to the consumption of contaminated ready-to-eat meat products of a meat packaging plant in Ontario. These incidents led to a widespread recall of meat products and some temporary plant closures to trace the source of contamination. There had been 57 confirmed cases of listeriosis, causing or contributing to 22 deaths. Later, the Canadian Food Inspection Agency (CFIA) introduced enhanced food safety measures for ready-to-eat meat plants.
In August and September 2008, several types of cheese products were recalled in Quebec and Ontario because of possible Salmonella and Listeria contamination. Added to the list were Salmonella contamination in a chocolate factory and E. coli contamination of burgers sold at a fast-food outlet, both in Ontario.
Following the detection of melamine contamination of imported Chinese wheat gluten in 2007, child illnesses and deaths from melamine-contaminated milk and milk products in China received worldwide attention in 2008. In September and October 2008, the Canadian Food Inspection Agency issued recall notices for a number of imported Chinese food products made with melamine-contaminated milk.
Retail prices
Fluctuating commodity prices in world markets and the depreciation of the Canadian dollar against the U.S. dollar in the second half of the year had a mixed impact on retail prices of food products in 2008. Canadian retail prices of rice and wheat-based food products such as flour, bread and pasta followed the rising trend of world grain prices. Flour prices increased sharply from January to July 2008 and then fell at a slower rate between August and December to end the year with an average annual increase of 34.5 per cent. In 2008, bread prices rose steadily between January and April (about eight per cent) fluctuated between May and September, increased 3.2 per cent in October and remained close to that level for the rest of the year. Overall, the average price of a loaf of bread was 15.1 per cent higher in 2008 compared to that in 2007. On average, pasta and rice were 31.9 and 17.4 per cent more expensive, respectively, in the retail markets in 2008 than a year earlier.
Retail prices of beef and pork remained relatively stable in 2008, with annual increases averaging only two and 1.4 per cent, respectively. In contrast, the retail prices of chicken and milk went up 4.1 and 5.2 per cent, respectively. On an annual average basis, retail prices of fruits and vegetables registered increases of 1.6 and 1.4 per cent, respectively in 2008. However, retail prices of fresh vegetables rose at the end of the year with the depreciation of the Canadian dollar against the U.S. dollar. The highest monthly increase was recorded between October and November 2008, when prices of fresh vegetables went up 20 per cent.
Food manufacturing is Canada’s second largest manufacturing industry after transportation equipment manufacturing. Data from the Monthly Survey of Manufacturing show that food manufacturing sales continued to grow in 2008 (grew one per cent on an annualized basis) to $71.8 billion, and its share in total manufacturing also rose to 13.1 per cent, which was a percentage point higher than in 2007. Despite the economic downturn, total retail food and beverages sales in Canada grew 5.5 per cent on an annualized basis in 2008 while total retail sales of all commodities grew 3.4 per cent. This lends some support to the fact that food manufacturing and retail food businesses are often viewed as recession-proof as retail food demand remains largely unaffected by an economic downturn. In a developed economy, where food expenditures constitute a relatively small share of the total household spending, consumers are less likely to cut back on grocery expenditures during an economic downturn.
Agri-food sector’s contribution to the overall economy
According to the Canadian Labour Force Survey, there were about 327,000 people employed in Canadian agriculture in 2008, which was 1.8 per cent of the Canadian labour force. This included farmers and all hired labour 15 years of age and over. The Canadian food manufacturing industry directly employed 226,252 people in 2008. The beverage and tobacco product manufacturing industry employed another 26,695 for a total of 252,947 workers, 15.1 per cent of total manufacturing employment.
In that sense, Canada is a mature economy with respect to the overall contribution of agriculture to the gross domestic product (GDP). The goods and services produced by agriculture and food industries together represented about eight per cent of Canadian GDP in recent years.
Agriculture’s contribution to the national economy increased
Net value added is one of the measures of agriculture’s contribution to the national economy’s production of goods and services. In 2008, agricultural production added a net value of $14.9 billion (in current dollars) to Canada’s economy, an increase of $5.4 billion over 2007. Higher prices for grains and oilseeds combined with a good crop production largely contributed to the increase.
The net value added by agriculture depends on climatic factors such as temperature, rainfall, humidity and frost that affect domestic production and market factors such as global demand and supply of major farm products, as manifested in their price changes in the world markets. The Prairie drought in 2002 and the commodity price depression in 2005 that continued up to the third quarter of 2006 were factors in the decline of net value added for those years. Price increases in the grain and oilseed markets and good production caused the net value added to recover in 2007 and rise in 2008.
Labour productivity
In the Agriculture, Forestry, Fishing and Hunting sector, labour productivity increased 4.6 per cent in 2008. Over the past five years, this sector registered an increase in labour productivity at an annual average rate of 3.8 per cent. This is the fastest rate of all major goods producing business sectors and is well above the average for the total economy. In addition to continued mechanization of agriculture with farmers’ adoption of labour-saving and output-enhancing technologies and better farm management practices, the 2008 productivity growth was largely attributed to increases in yield and production of grains and oilseeds.
Agricultural trade
As one of the world’s leading agri-food trading nations, Canada continued to export more agri-food products than it imported in 2008. As a result, the nation’s trade surplus in agricultural and fish products rose from $8.9 billion in 2007 to $12.3 billion.
Canadian exports of agricultural and fish products increased 18.7 per cent over 2007 to $40.9 billion in 2008. This was due to the strength of wheat, canola, barley and meat exports. The world demand for canola continued to increase with its growing use in biofuel production and rising consumer preferences for cooking oils containing relatively lower proportions of saturated fatty acids. These combined forces exerted upward pressure on canola prices in the international markets, especially during the first half of 2008. As a result, the value of canola exports increased to $3.9 billion in 2008, up 71.2 per cent from 2007. Similarly, the value of wheat exports increased 48.1 per cent to $6.9 billion. This increase was due to the combined effect of rising prices resulting from low world wheat stocks and robust demand from countries such as India and China.
Following the bovine spongiform encephalopathy (BSE) shock in 2003-04, live animal exports began to recover in 2005, which continued up to 2007. Compared with 2007, the value of live animal exports fell 4.2 per cent to $2.3 billion in 2008 because of low livestock prices, a close to par Canadian dollar with the U.S. dollar during the first half of the year and some requirements of the U.S. COOL regulations during the latter part of the year
The value of agricultural and fish products imports increased 11.7 per cent to reach $28.5 billion in 2008, with all major categories registering increases. Only two minor items, tobacco and cotton, registered import declines. Fodder and feed imports grew 29.2 per cent to about $1.5 billion mainly due to increases in feed prices. Imports of corn, a primary input to biofuel, grew 28.7 per cent as the Canadian biofuel industry continued to expand in 2008. Corn imports reached $705 million, up from $548 million in 2007.
The agricultural trade surplus as a share of the total trade surplus grew significantly in 2008. The share of agricultural trade surplus in total trade surplus fluctuated between 1999 and 2004 and reached 12.9 per cent in 2005, the lowest level in 10 years (1999-2008). The share began to increase from 2006 and reached 26.3 per cent in 2008 which was its highest level in 10 years.
In review
In 2008, net farm income increased sharply to $6.1 billion from $1 billion in 2007 on the strength of increased crop inventories in Saskatchewan, Alberta, Manitoba and Ontario. While crop producers benefited from higher prices and a good harvest, many livestock producers were adversely affected by higher feed costs and reduced prices resulting from the strong Canadian dollar as well as uncertainty over the COOL regulations in the U.S.
The impact of the COOL regulations on Canadian cattle and hog exports is evident in the livestock statistics released in August 2009. During the first half of 2009, exports of cattle and hogs (number of heads) declined by about a third from the same period in 2008.
Canadian crop farmers expect reductions in yields and harvest areas of principal field crops in 2009. According to the July farm survey estimates, production of all major field crops except soybeans and flaxseed is expected to decline in 2009, mainly due to lower than average temperatures in the growing season and very dry conditions in major crop-producing areas of the Prairie provinces.
— From the study Canadian Agriculture: The Year 2008 in Review, released Nov. 10, 2009 by Statistics Canada.