The price of flax has held up relatively well compared to the price of soybeans and canola.
While the cash price of flax has recently bounced back to $16.50 per bushel, bringing it within $1.25 per bushel of the spring high at $17.75, the spot price for canola has declined $3 per bushel from its recent high of $15 and soybeans are also down $3 per bushel from their crop year high of $16.
With the absence of a futures market for price discovery, many in the flax industry including flax producers analyze the fundamental situation for flax in an attempt to predict future price direction. They will delve into government reports such as Agriculture and Agri-Food Canada, Statistics Canada and USDA or rely on reports from the private trade.
Read Also
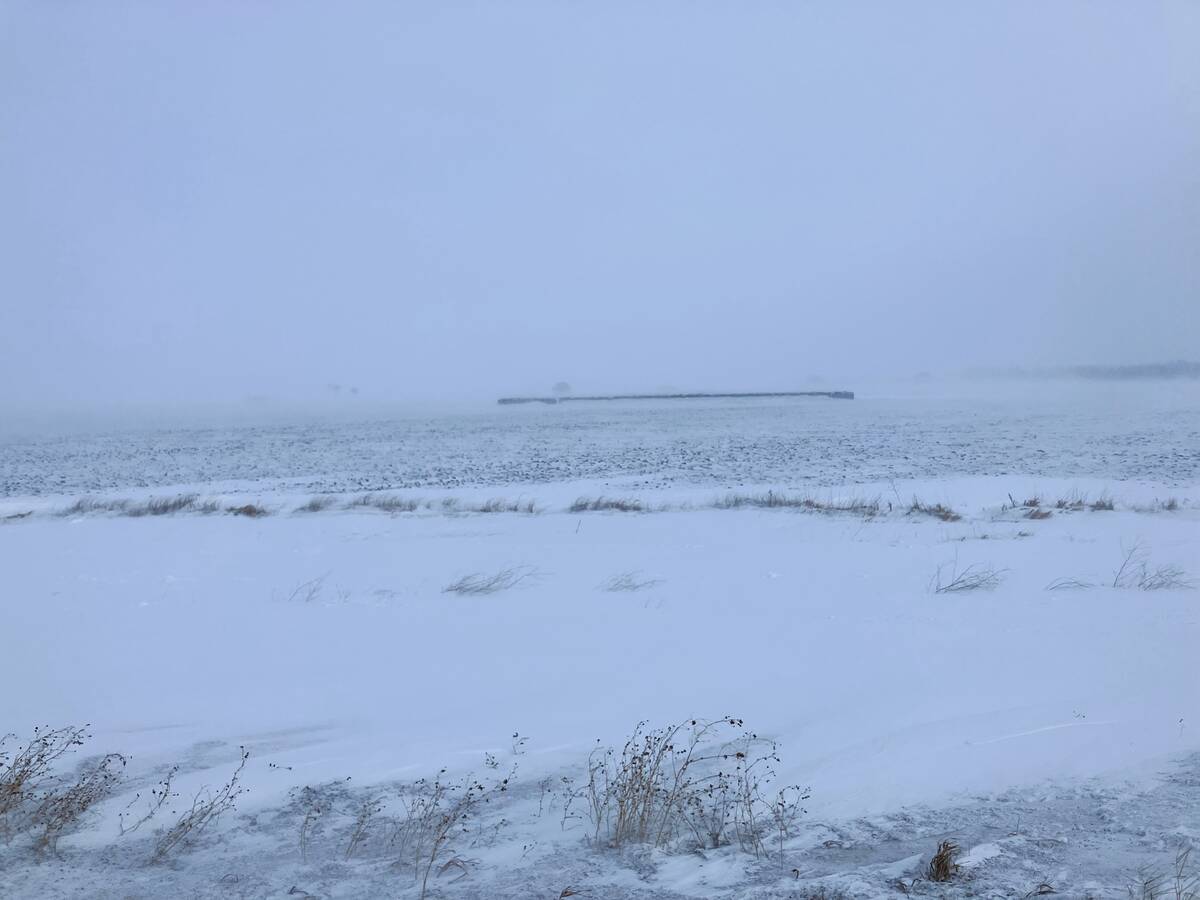
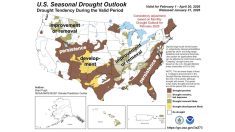
Southern Prairies brace for dry spring after below-normal winter
A dry winter across southern Alberta and Saskatchewan raises crop concerns for 2026, while northern regions benefit from above-average snow.
USDA is estimating U.S. farmers will seed 223,000 acres of flax in 2013-14, which is a 35 per cent decline from 2012.
Statistics Canada is estimating Canadian farmers will increase flax acreage 16 per cent to 1.135 million acres, up 155,000 acres over last year.
In their July 17, 2013 Outlook for Principal Field Crops, Agriculture and Agri-Food Canada is estimating a 12 per cent increase in 2013-14 flax production to 550,000 tonnes. However, they are also predicting the carry-out will remain a tight 60,000 tonnes for the second year in a row on forecasts of an 11 per cent increase in exports on continued strong Chinese and U.S. buying.
Other analysts rely on technical analysis for determining price direction and although this form of analysis is most widely accepted in charting futures prices, it is not commonly known that this valuable aid also works well when charting cash prices.
For example, those who were charting the cash price of flax were focused on the development of an ascending triangle and were patiently waiting for the impending rally above $14.60 per bushel.
Ascending triangle
Ascending triangles will generally prove to be continuation patterns, but I have often seen them form at market bottoms. In these instances, the ascending triangle is a reliable indicator that prices are about to turn up from a major low.
In an ascending triangle, the upper boundary is horizontal with the lower boundary rising from left to right. These areas (lines) are illustrated in the accompanying chart. The expectation is for prices to rise through the flat side, occurring between one-half and two-thirds the horizontal distance from the triangle’s base.
Volume within the triangle should increase on rallies and subside on declines, but must increase noticeably as prices penetrate the horizontal side.
A minimum price objective may be determined by constructing a line from the first high in the triangle (A), parallel to the ascending boundary line (B). The measurement is not fixed at a particular price level, but will be proportional to time. In other words, the longer the advance progresses, the higher will be the measured objective.
Market psychology
The flat side of the ascending right triangle is a point of resistance and represents a supply of contracts to be sold at a given price. Market movements up to this level are turned back as long as the supply of contracts exceeds the demand.
Prices recede from the flat side, but purchasers raise their buying ideas causing these declines to become progressively smaller. Each probe of the horizontal resistance leaves fewer contracts to be absorbed, until finally prices break through the former resistance level, attracting new buying.
Successful penetration of the pattern’s flat side signals a resumption of the price advance. The probability of a triangle being a continuation pattern is highest in the ascending right triangle.
Farmers who recognized the development of the ascending triangle formation were rewarded by waiting for flax prices to exceed the upper boundary at $14.60 and for the upside objective to be attained before making a sale.
Send your questions or comments about this article and chart to [email protected].