CNS Canada — Statistics Canada raised its production estimates for most crops across Western Canada in its latest report released Wednesday.
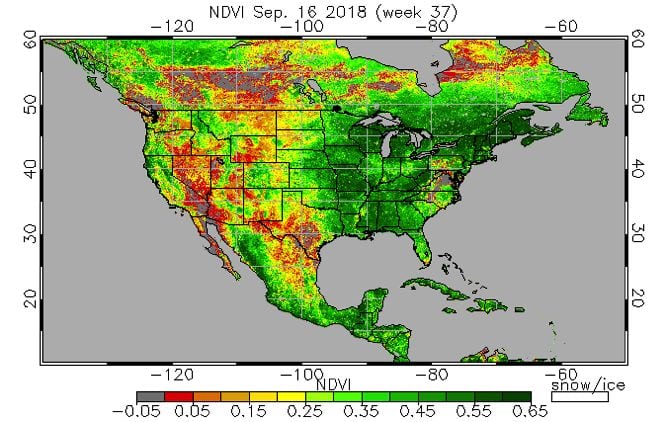
Unlike traditional StatsCan reports using information gathered from phone surveys, the model-based report was based in part on coarse-resolution satellite imagery collected during the month of August.
The model-based report has only been in existence for a few years and has yet to win the same level of attention as the traditional method.
The agency’s traditional-method report on Aug. 31 had estimated Canada’s 2018-19 canola production at 19.2 million tonnes — but that number grew to 21 million in Wednesday’s report.
Read Also

Alberta crop conditions improve: report
Varied precipitation and warm temperatures were generally beneficial for crop development across Alberta during the week ended July 8, according to the latest provincial crop report released July 11.
“I’m shocked,” said Ken Ball of PI Financial in Winnipeg. “I kind of thought with the weather year we had, this model might come out on the low end.”
Those thoughts were echoed by other traders in the industry, who thought the difference in the two estimates was extremely large.
“That’s huge; that’s like 10 per cent,” said Bill Craddock, a trader who also farms near Winnipeg.
The reaction to the hike in production was somewhat muted as canola dropped around $1 in the wake of the report.
Most analysts said they would be watching for the end-of-year numbers to see which report was more accurate.
“The two stories just aren’t the same,” said Neil Townsend, a senior analyst with FarmLink Marketing Solutions in Winnipeg.
Reports from StatsCan tended to follow a similar trend, he said, with the survey-based production report initially underwhelming investors. After that the satellite data would come out and exceed its survey-based counterpart, with the final numbers eclipsing them both.
“Nobody knows how seriously to take this thing,” said Ball. “Obviously the model has gone down its own path.”
Most other crop numbers were also hiked, with all-wheat growing from an Aug. 31 estimate of 28.9 million tonnes to 31 million under the satellite-based model.
“The wheat number was a little bit negative for the market,” said Keith Ferley of RBC Dominion Securities in Winnipeg.
Both Townsend and Ball agreed the end-of-year numbers for all-wheat could be over 31 million tonnes.
“If the December report comes out and lines up with the model, then StatsCan has a better argument for saying the model is the best way to go,” said Ball.
— Dave Sims writes for Commodity News Service Canada, a Glacier FarmMedia company specializing in grain and commodity market reporting.


