It would take more than a thousand words to even briefly describe the weather during last year’s growing season.
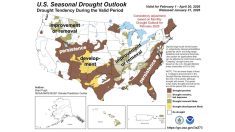
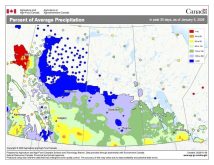
But provincial agrometeorology modelling expert Ralph Wright was able to do that in four colour-coded maps.
For example, March-May precipitation map is a sea of bright and dark red (indicating conditions seen once every 25 years or longer) stretching from the top of the province to the far south.
However, the temperature map from Sept. 26 to Oct. 10 is the most dramatic with virtually all of the province seeing way-below-normal temperatures that occur either once in a generation or every second generation.
The maps can be found in the Feb. 3 edition of Agri-News at alberta.ca.